Tracking and Staying in Charge of Your Cycles
Lesson 19
Lesson Objectives:
-
Learn the basics of the tracking tools on FertilityFriend.com to help you manage your fertility data.
Major Points in this Lesson:
-
Keeping your cycle data organized and well-managed can help you communicate effectively with your healthcare provider, reduce waiting times and help to ensure that appropriate diagnostic testing is available.
-
Tracking cycle data can help you see trends and patterns in your cycles and keep you in control of your reproductive health.
-
Charting online or on your smartphone app can help you stay organized and in control.
-
FertilityFriend.com offers a variety of features to help you maintain control of your reproductive health.
One of the best things about charting your cycles is that you can stay organized and in control. This can help you to communicate more effectively with your healthcare provider and to see your own trends and patterns.
Charting electronically makes it very easy to stay organized. You can keep your charts and associated fertility data in one easy-to-locate place. FertilityFriend.com offers various features to help you manage your cycle information and maintain control over your reproductive health.
Some features that help you to maintain control and stay organized are:
Thumbnails
On your mobile app, "Thumbnails" (Analysis Tools) also offers a view of all charts on the same page. This is useful to compare patterns from cycle to cycle.
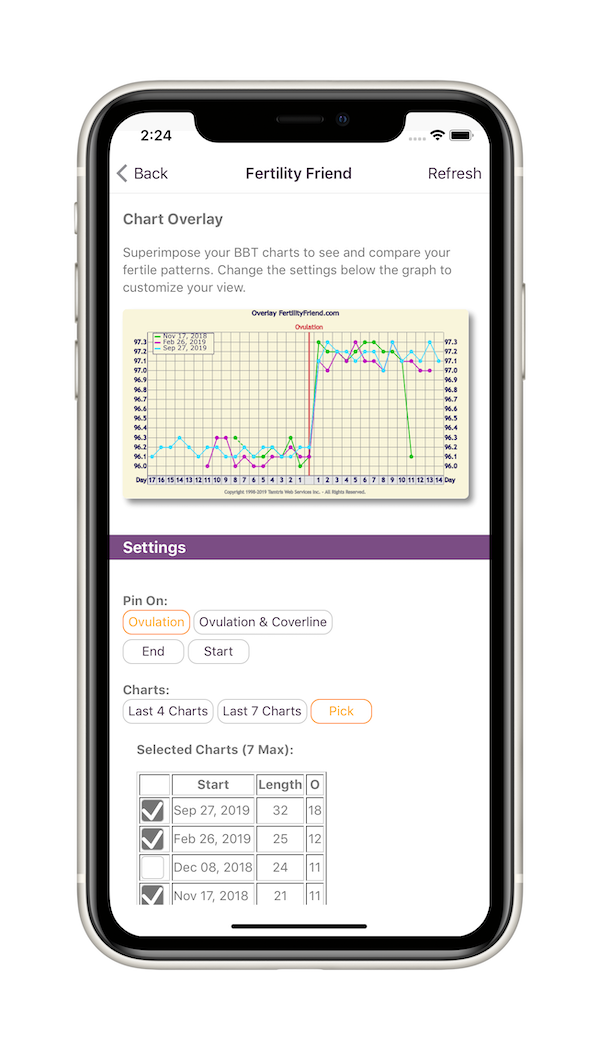
Overlay Charts:
The Overlay feature ("Analysis" tab in the app) allows you to place several charts on the same graph so that you can discern your usual chart patterns and variations from your norms. The illustration below shows how the chart overlay allows you to compare cycles.
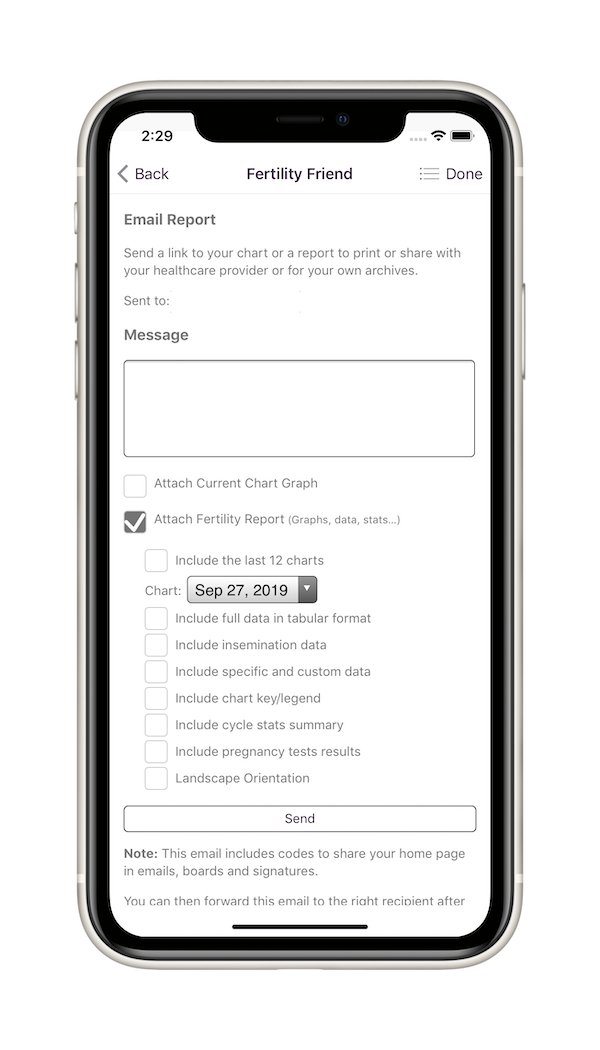
Print/Download Charts:
Printing or generating a Fertility Report of your charts (More menu/Sharing in the app) allows you to bring your data to your healthcare provider in a clean and clear format. This can aid communication with your healthcare provider and makes you an active participant in your own care. Ultimately, this can improve your care and show your care provider that you are serious and knowledgeable about your body and your health. Showing your charts to your care provider can help to time treatments and procedures. It can also cut your waiting time for diagnostic testing and make sure that you receive the appropriate diagnostic testing. Alternatively, if your provider is willing, you can also email the PDF report to your healthcare provider prior to appointments.
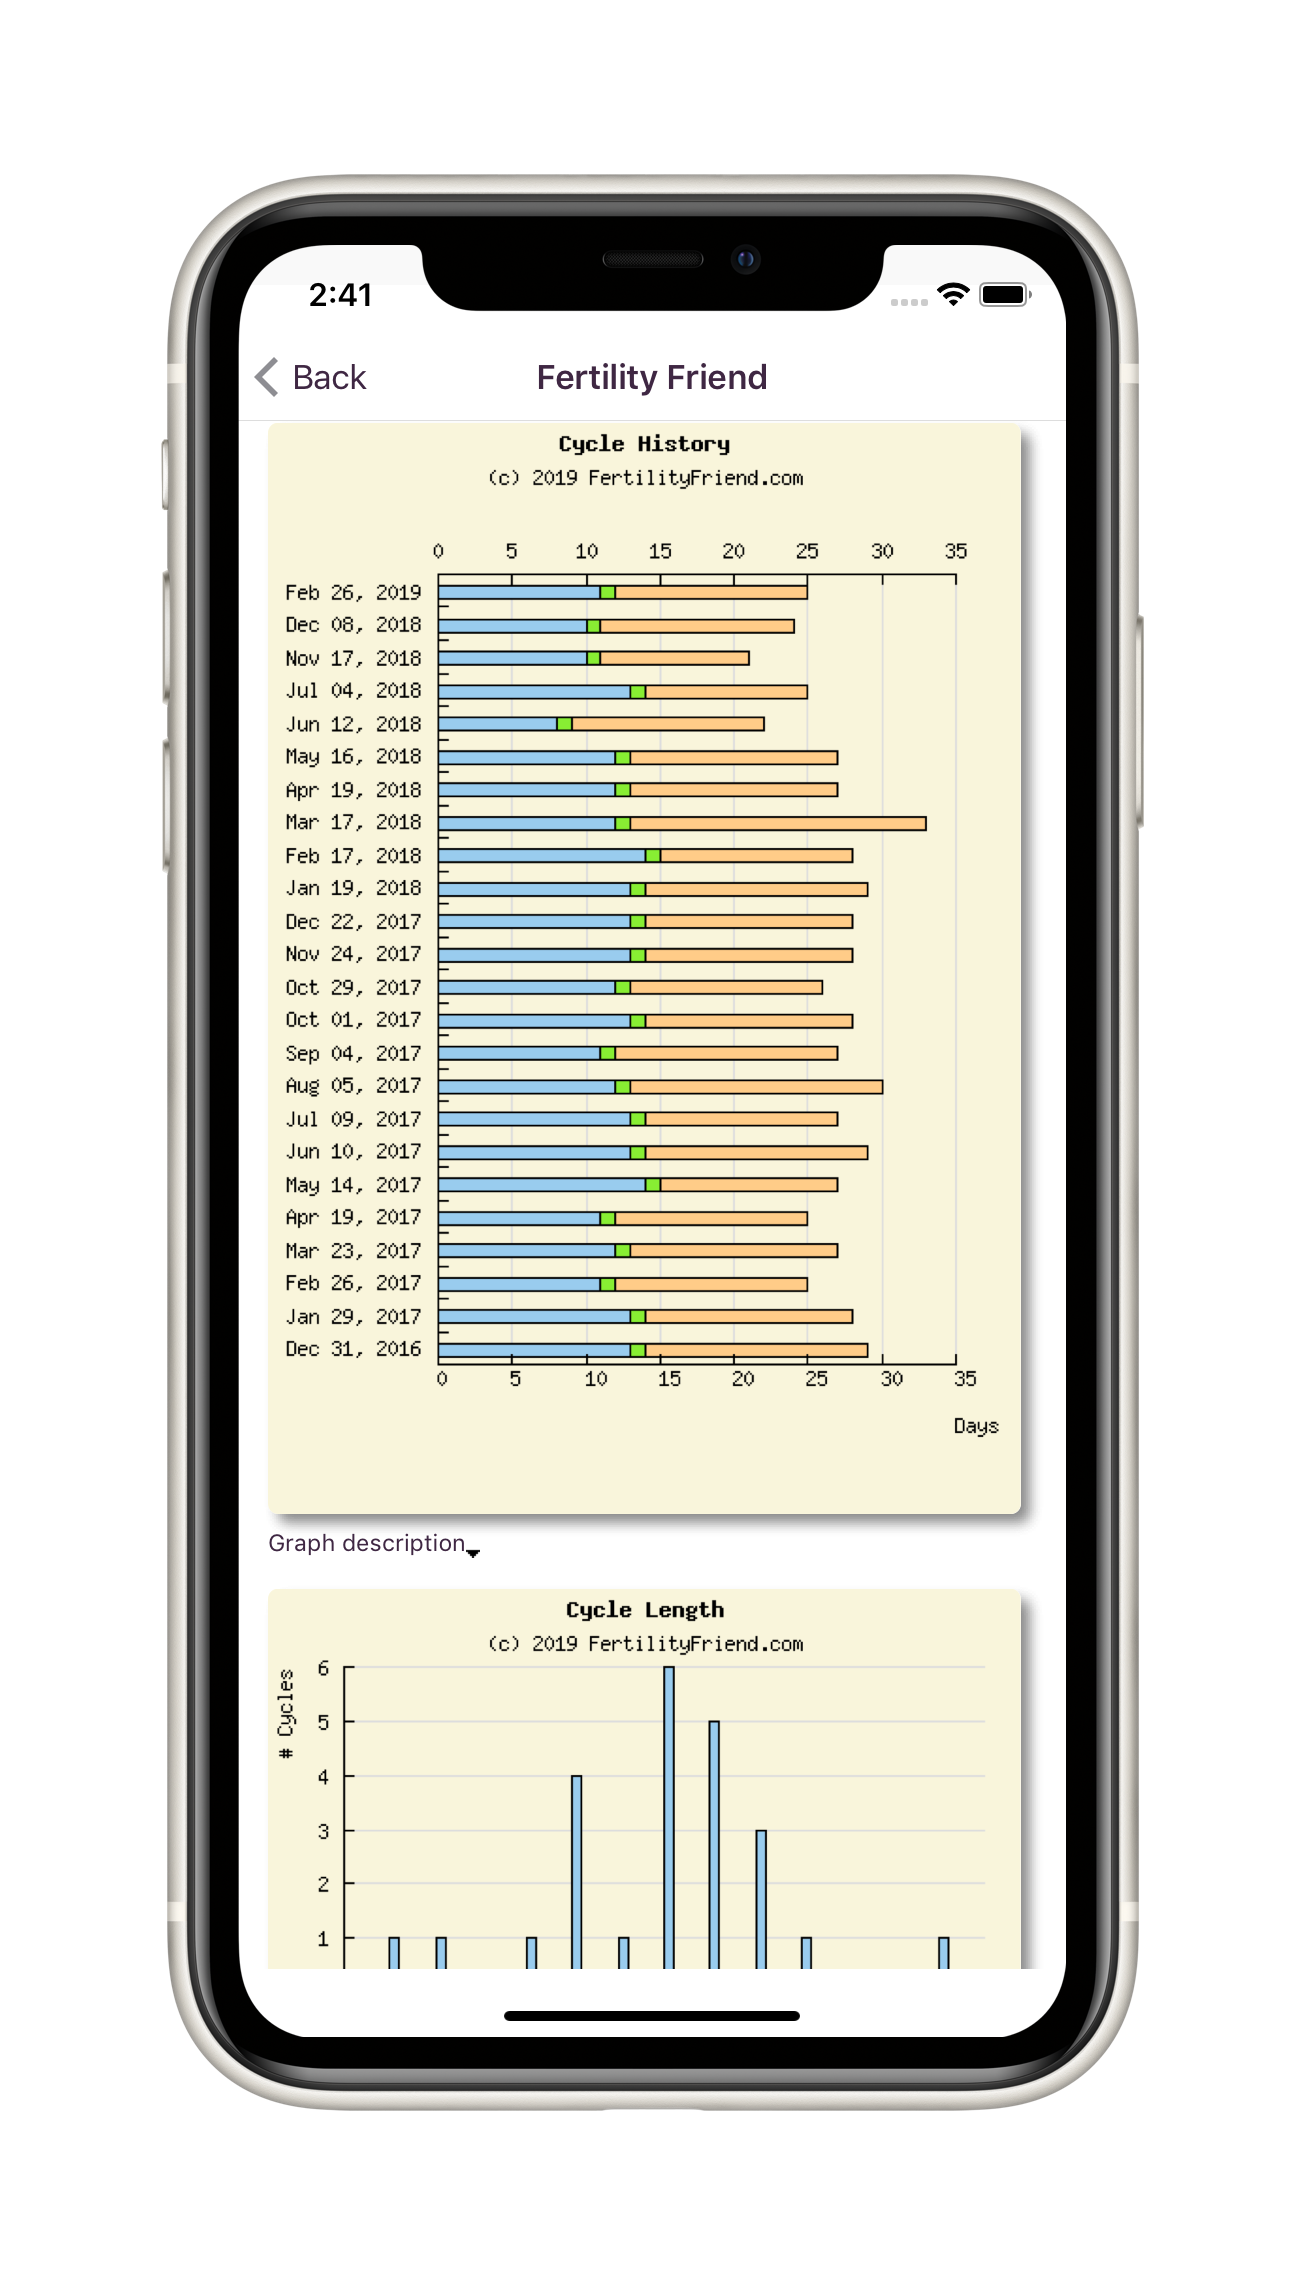
Stats Graphs
The Stats Graphs (Analysis tab within your App) allows you to see your cycle trends. It shows bar graphs representing the distribution of your cycle length, ovulation day and luteal phase length. You can easily see your usual patterns and data.
Custom Data Entry
These features allow you to easily associate symptoms, events, medications or supplements, moods or anything else with a day of your menstrual cycle. This allows you to see if specific symptoms are related to your menstrual cycle and to easily view your data in the context of your cycle history.
To go further:
Explore the menus to see various other features to help you stay organized and in control.
Next Lesson: Supporting Each Other: Sharing Your Trying to Conceive Journey
Note: This lesson does not have a quiz.