Lesson Objectives:
Be able to identify an ideal ovulation pattern
Be able to detect ovulation on charts with clear ovulation patterns
Understand the interpretation methods used by FertilityFriend.com
Major Points in this Lesson:
Ovulation can usually be detected for the day before the temperature shifts.
Ovulation usually occurs on or around the last day that fertile cervical fluid is observed.
Once you see three temperatures in the higher range and cervical fluid has dried up, you can be reasonably sure that ovulation has passed and you are no longer fertile.
FertilityFriend.com interprets and analyzes your chart automatically for you based on the data you enter.
More...
Interpreting the fertility
chart is a combination of math, science, art and experience.
FertilityFriend.com will
automatically detect ovulation, interpret and analyze your chart for
you based on the data you enter. When your data is complete and
reliable, your interpretation will be most accurate and reliable.
Though FertilityFriend.com makes calculations and predictions for you
based on your data, it is recommended to have a clear understanding
about how the interpretations are made.
The ease with which a chart may be interpreted depends on the reliability and accuracy of the data entered and the clarity of the chart pattern. Some charts are very easy to interpret while others require a bit of extra analysis and flexibility. With each cycle charted, interpreting the fertility chart becomes increasingly easier.
An ideal chart pattern
shows all your fertility signs lined up to suggest the same ovulation
date. In this case, detecting ovulation is fairly straightforward:
when cervical fluid has dried up and a thermal shift of three days or
more has been observed (temperatures are higher than the previous
several temperature points for at least three days), ovulation can be
detected for the day before the temperature shifted.
After the three days of
higher temperatures, ovulation is shown on the chart with a vertical
red line crossing the chart on the cycle day of ovulation. At this
time, a coverline (a red horizontal line) is also drawn on your chart
as a visual tool to help you see the ovulation (biphasic) pattern.
When the cycle pattern is clear, the coverline will usually be higher
than most of your pre-ovulation temperatures and lower than most of
your post-ovulation temperatures. The coverline has no physiological
meaning and is only used as a visual tool to help you see your chart
pattern.
You should consider yourself fertile, and continue to have intercourse, until a clear thermal shift is observed on your chart and the crosshairs showing ovulation and your coverline are drawn on your chart.
To illustrate, the charts below from FertilityFriend.com's chart gallery show an ideal chart pattern with a clear thermal shift around the time cervical fluid dried up. The patterns and details vary, but you can see how observing and recording your signs can show you your ovulation date and fertile days.
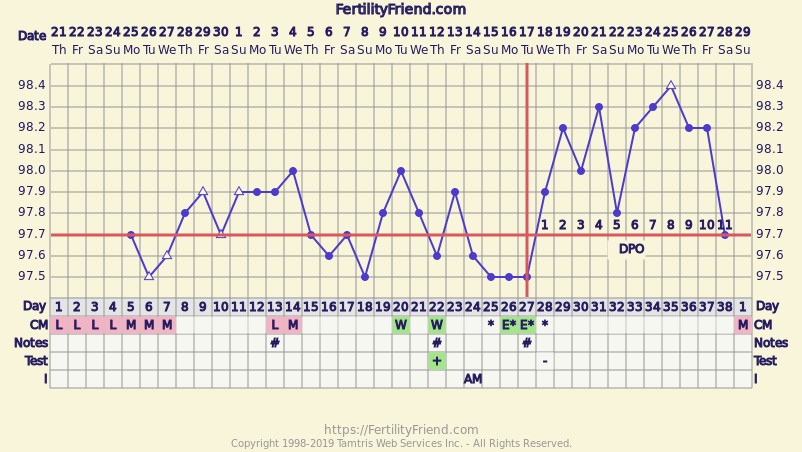
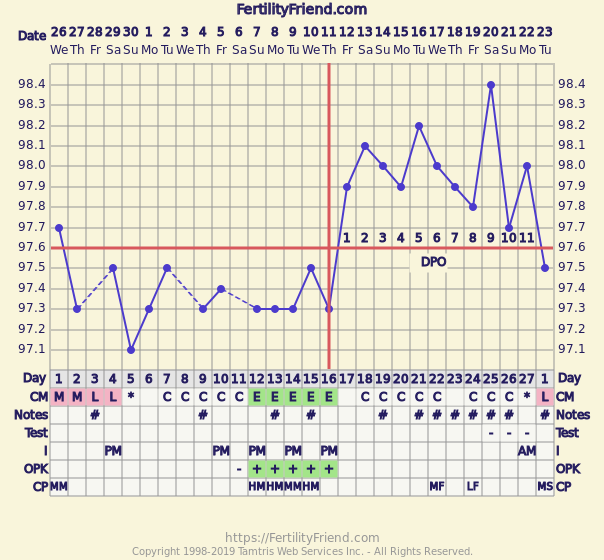
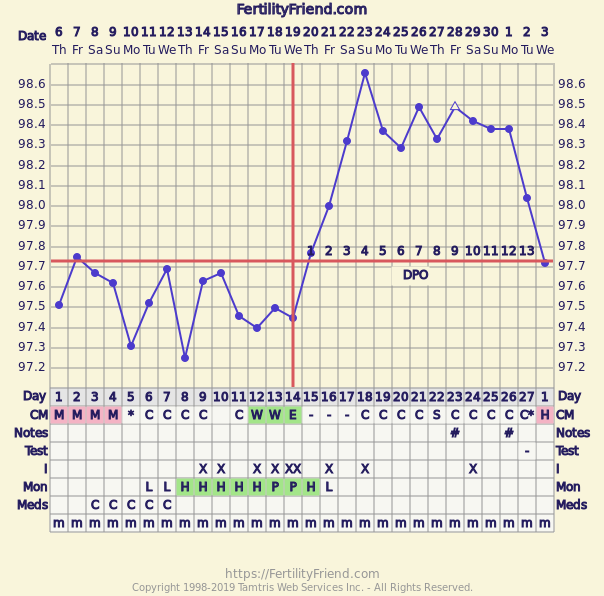
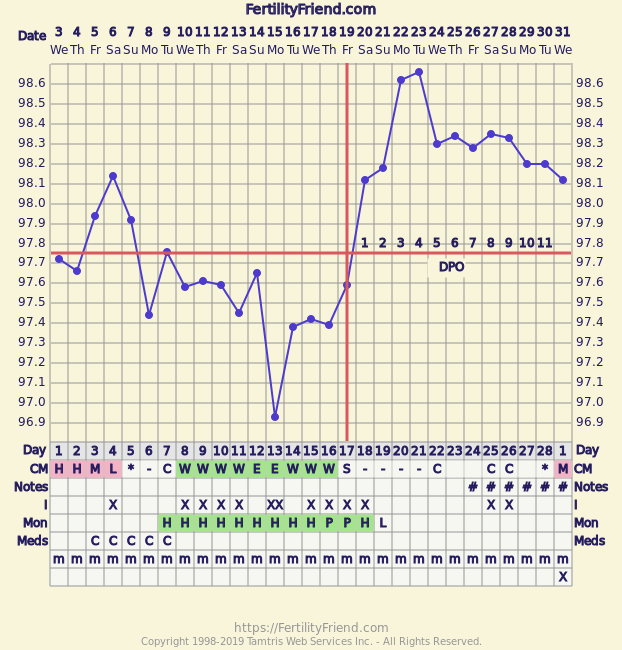
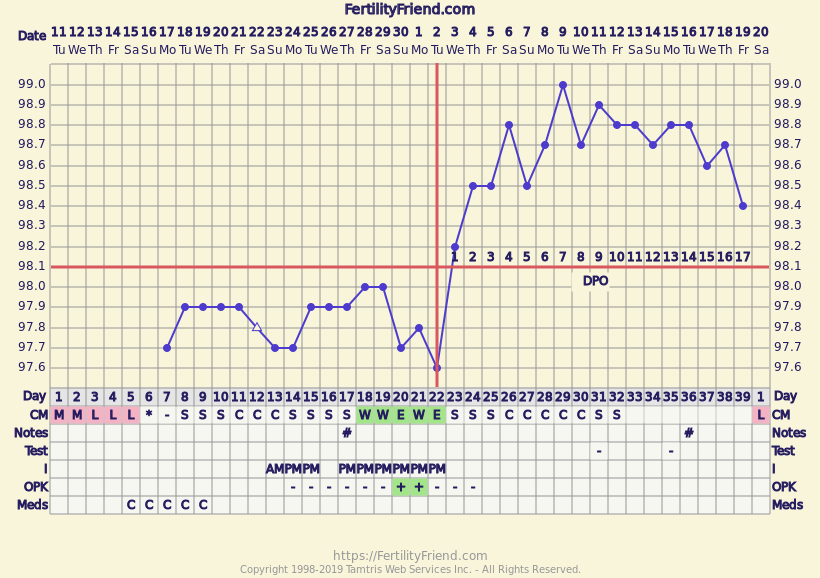
Chart patterns are not always perfectly clear, however, so sometimes a bit of extra interpretation and flexibility is needed. If you are trying to conceive, it is recommended to keep on considering that you could be fertile if ovulation cannot be clearly determined on your chart. If there is any doubt at all that ovulation has already passed, keep on considering yourself fertile to increase your chances of conception.
FertilityFriend.com- whether online or on your smartphone app- has a flexible system for interpreting the fertility chart based on the data you enter and the pattern of your chart. You can choose among four different methods to calculate ovulation.
Advanced Detector: The default and recommended ovulation detector is the "Advanced detector". There is generally no need to choose any other interpretation method. The advanced ovulation detector is a refined and flexible fertility awareness method that detects most ovulation patterns, even ones that are not ideal. It has been fine-tuned to recognize a variety of ovulation patterns and takes all signs into account simultaneously.
Research Detector: This detector includes new patterns and improvements as we find them. With time and testing, we roll new findings into the advanced detector when appropriate. You should use this detector only if you wish to check for enhancements that are not yet rolled into the advanced detector.
Fertility Awareness
Method (FAM) Detector: Based on the Fertility Awareness rules
developed in the 1960s, this detector detects ovulation once three
temperatures greater than 0.2-0.4 degrees Fahrenheit or 0.2 degrees
Celsius above the previous six are recorded. Ovulation is detected
for the day before the temperature rise and a coverline is drawn at
0.1 degree above the highest of those six pre-ovulation temperature
points. This detector is best suited to those with regular chart
patterns who are already familiar with this method.
OPK/Monitor Detector:
This detector relies solely on your Ovulation Predictor Kit (OPK)
or fertility monitor data to determine ovulation. It is recommended
for people who are not monitoring temperatures or when temperatures
are not offering a reliable pattern.
You can change your interpretation method on FertilityFriend.com using the menu Analysis/Tuning for the current chart and the menu Settings/Charting options for future charts.
Further Reading:
Next Lesson: Typical Chart Patterns.
Note: Please check this lesson within the app to access the lesson quiz.
© Tamtris Web Services Inc.
Terms Of Service || Privacy Policy || Contact